
The Lendela Team
September 2nd, 2026
Table of contents
- The cost of living did not move as one thing. Between June 2016 and June 2026, transport rose 51% and food 28%, while clothing fell 0.4% and phone and internet fell 5.5%.
- On everyday costs, pay kept up. Real purchasing power compounded roughly 23% over the decade against daily expenses rising about 21%.
- The gap opens on the big two. Housing rose about 50% and COE about 51% over the same decade, faster than the income meant to reach them.
- HDB resale prices have stopped climbing. As of Q2 2026 the index has been broadly flat for a year and has declined for three consecutive quarters.
- Young Singaporeans are not impulsive spenders. IPS research found 88.8% spend within their income, while 80% still worry they spend too much.
Nobody agrees on what a decent life costs here
Ask ten people in Singapore what a comfortable life costs and you will get ten different numbers, all of them said with confidence, none of them the same.
Part of that is because the answer genuinely depends on the life. But part of it is because the cost of living did not move as one thing. Over the past decade it split. Some categories got cheaper. Some barely moved. A few ran away entirely.
This is the second piece in The Real Price Of, a series where we add up what things actually cost in Singapore, not just the sticker price. Every figure below is dated and sourced, and where two sources measure the same thing differently, we have said so rather than picking the tidier number.
The essentials moved in opposite directions
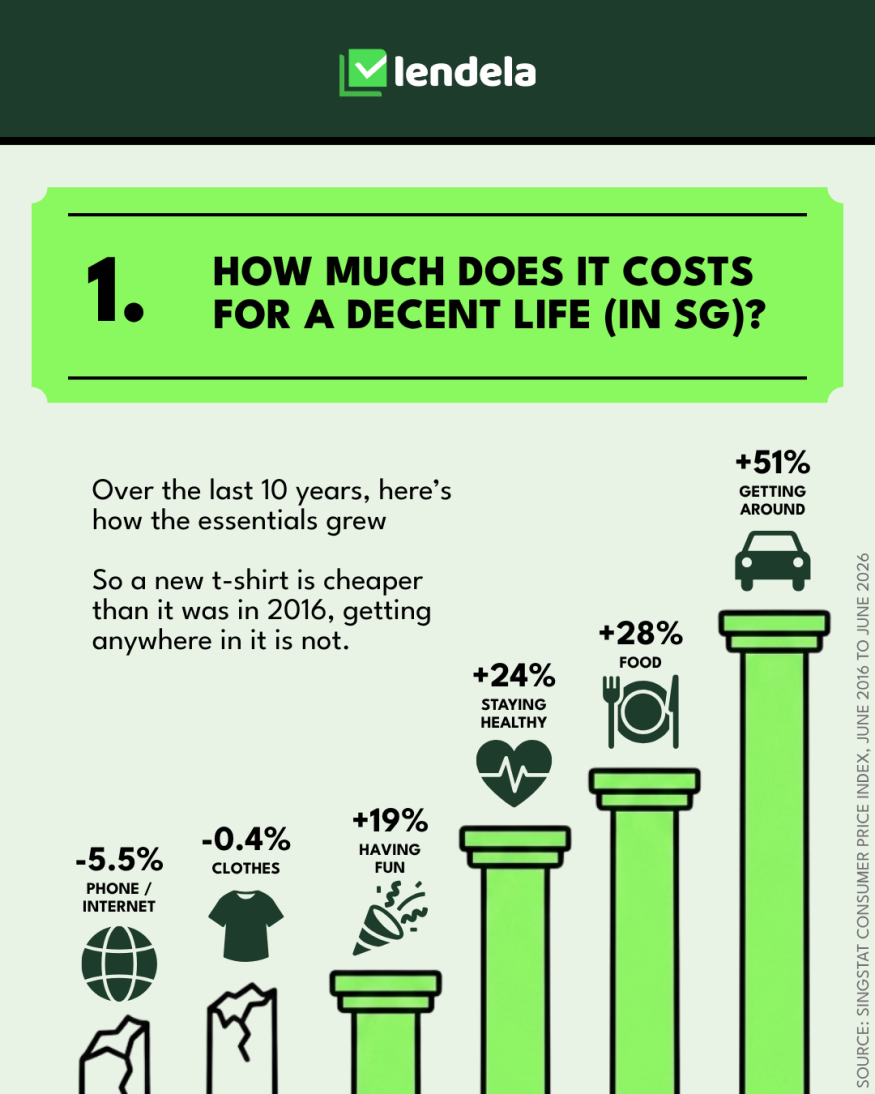
Between June 2016 and June 2026, according to SingStat's CPI (Consumer Price Index) :
Category | Ten-year change |
|---|---|
Phone and internet | −5.5% |
Clothing | −0.4% |
Having fun | +19% |
Staying healthy | +24% |
Food | +28% |
Getting around | +51% |
A new t-shirt costs slightly less than it did in 2016. Getting anywhere in it costs half again as much.
That single gap explains a lot of why headline inflation numbers rarely match how a year felt. The categories that fell are the ones you buy occasionally. The categories that rose are the ones you cannot opt out of. You can wear last year's shirt. You cannot skip the commute, the groceries or the clinic.
What is the Consumer Price Index?
The CPI tracks what a fixed basket of goods and services costs a typical Singapore household over time. SingStat compiles it monthly, and the basket is weighted by how households actually spend, using the Household Expenditure Survey, so food and transport count for more than stamps do.
It is the standard measure of inflation here, and it is the basis for most figures in this article. It is also an average of everybody, which is exactly why it can feel wrong in any individual case. A household without a car experiences a very different decade from one with two.
COE and housing did not rise. They took off.
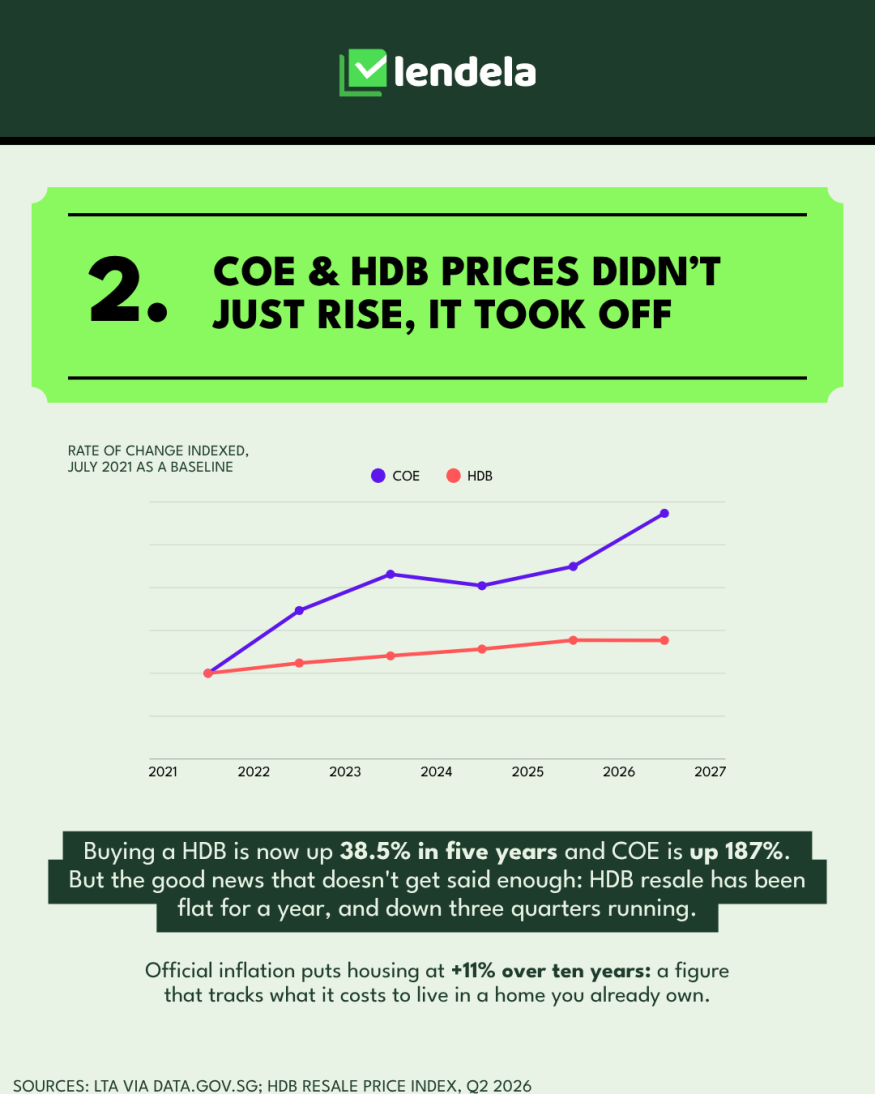
Indexed to July 2021, HDB resale prices are up 38.5% over five years and COE premiums are up 187%.
Measure | Window | Change |
|---|---|---|
COE premiums | Jul 2021 to 2026 | +187% |
HDB resale price index | Jul 2021 to 2026 | +38.5% |
Transport (CPI) | Jun 2016 to Jun 2026 | +51% |
Housing (CPI) | Jun 2016 to Jun 2026 | approx +11% |
Those numbers look wildly out of step with each other, and the reason is worth understanding rather than glossing over.
July 2021 was close to the bottom for COE. Quotas were tight and the market was still moving through the pandemic period. Measuring from a trough exaggerates the climb. Over the full decade, transport costs sit at +51%, which is still the fastest-rising category in the basket, just not a tripling.
The housing figures measure different things. Official inflation puts housing at roughly +11% over ten years, because CPI tracks the cost of living in a home, imputed rent, utilities, maintenance. It does not track the cost of buying one. The HDB Resale Price Index does, and it tells the harder story.
One piece of good news that does not get said enough: HDB resale has been broadly flat for a year, and down three quarters running as of Q2 2026. The line has stopped climbing.
3. Pay grew. It just did not grow fastest.
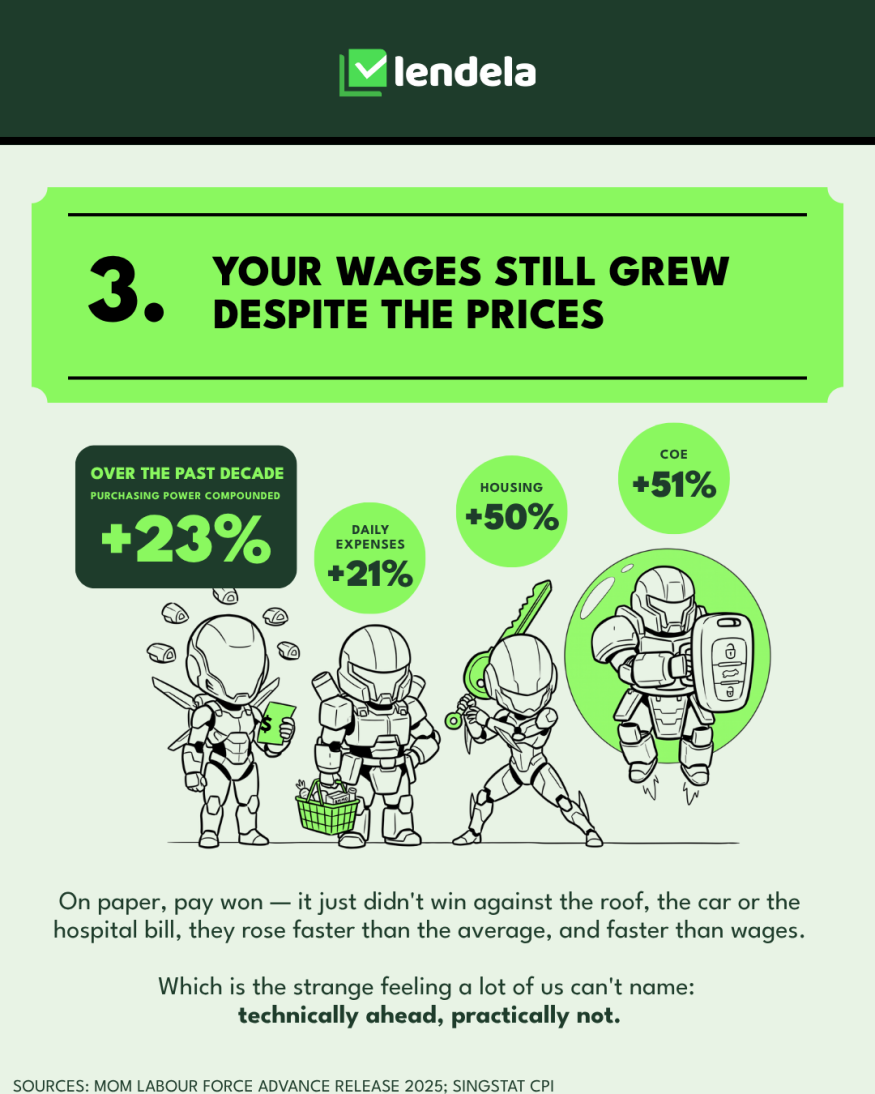
Real purchasing power compounded roughly 23% over the decade. Daily expenses rose about 21%. On the everyday basket, pay won.
Then housing rose about 50% and COE about 51%, and the win stopped feeling like one.
This is the specific shape of the feeling that is hard to name. Not that people are falling behind on groceries, because on that measure most are not. It is that the two purchases that mark out a settled adult life in Singapore, a flat and a car, moved faster than the income meant to reach them. Technically ahead, practically not.
It also explains why the cost-of-living conversation gets so heated. Two people can look at the same decade, cite accurate figures, and reach opposite conclusions, because one is describing the weekly shop and the other is describing the down payment.
There is a word for what happens next
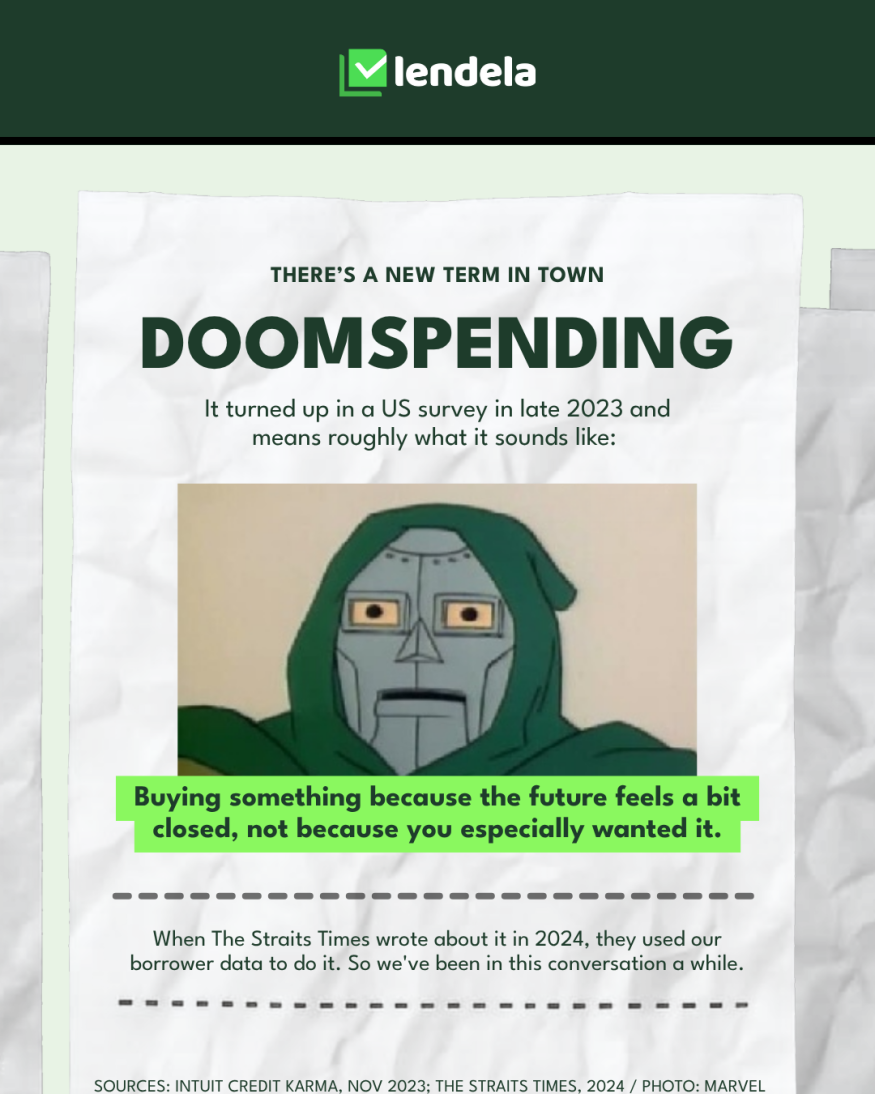
Doomspending turned up in a US survey by Intuit Credit Karma in November 2023, and it means roughly what it sounds like: buying something because the future feels a bit closed, rather than because you especially wanted the thing.
When The Straits Times covered the pattern in Singapore, they used Lendela's borrower data to do it. So this is a conversation we have been in for a while, and it is worth being precise about what the behaviour is and is not.
It is not recklessness. It is a rational response to a horizon that keeps moving. If the flat and the car both feel further away than they did five years ago, the marginal dollar stops looking like progress toward them and starts looking like something you may as well enjoy now.
What the research actually says about how Singaporeans spend
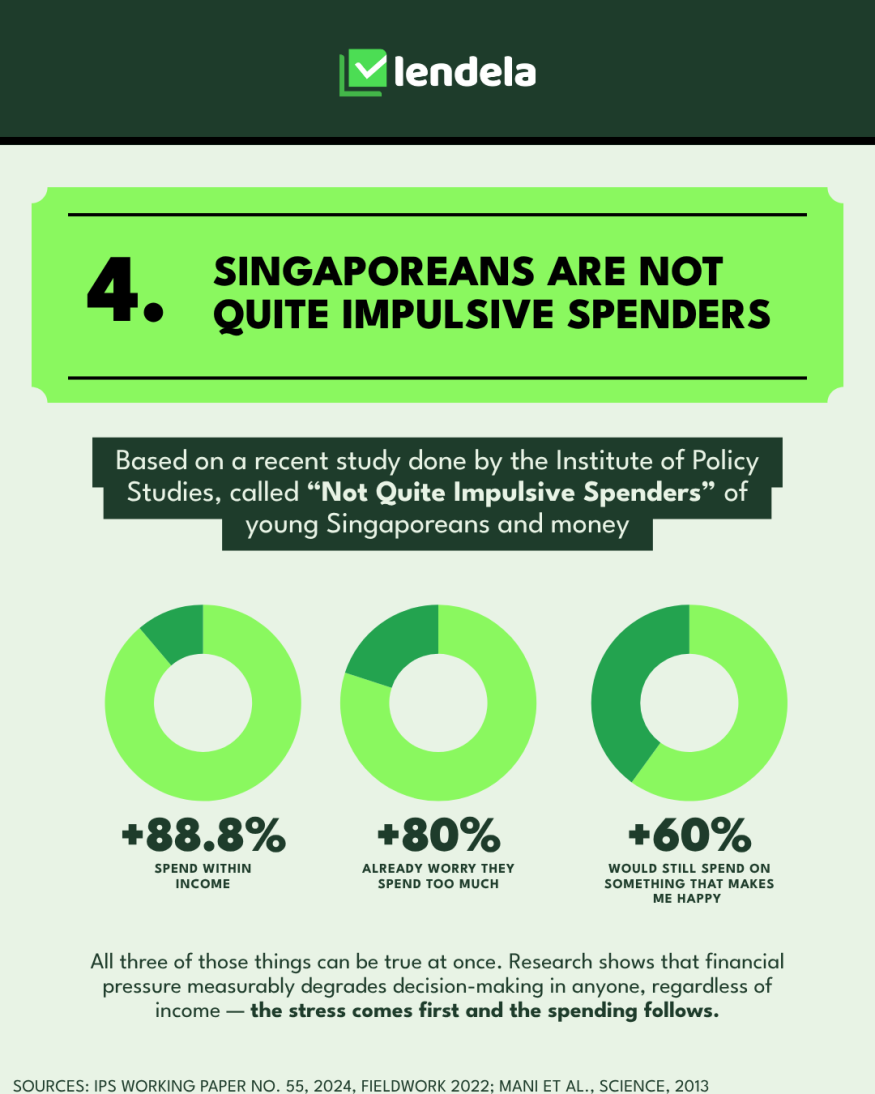
The Institute of Policy Studies published a study of young Singaporeans and money titled "Not Quite Impulsive Spenders" (IPS Working Paper No. 55, 2024, fieldwork conducted 2022). Three findings sit together in a way that is easy to misread:
88.8% spend within their income
80% already worry that they spend too much
60% would still spend on something that makes them happy
Those are not contradictions. They describe the same person. Someone can be financially disciplined, anxious about their discipline, and still unwilling to give up the one thing in the week they look forward to.
There is a mechanism underneath this. Research published in Science in 2013 by Mani, Mullainathan, Shafir and Zhao found that financial pressure measurably degrades decision-making, in anyone, at any income level. The stress tends to arrive before the spending, not as a consequence of it.
Which is a more useful frame than the one usually offered. The question is less about willpower and more about how much mental bandwidth a decision has to fight for.
The part you get to control

Very little on this page is within any one person's control. CPI is not a personal choice. Neither is a COE premium.
What is available is smaller and duller and genuinely useful: knowing the number. Most of the pressure in these figures comes from costs that arrive without being counted first, and the categories that rose fastest are precisely the ones people tend to plan for once and then stop revisiting.
If borrowing is part of how you cover something in that gap, whether that is a renovation, a medical bill or consolidating a few cards into one, the same principle applies. The figure that matters is the total repayment across the full tenure, not the monthly number, and it is worth seeing more than one offer before deciding which one you are living with.
Lendela matches you with offers from over 70 MAS-licensed lenders through a single form, so you can see your rates side by side without applying to each one separately, and without an impact on your credit score.
Frequently asked questions
What is the Consumer Price Index? The CPI measures the change in the cost of a fixed basket of goods and services purchased by a typical Singapore household. It is compiled monthly by the Department of Statistics Singapore, weighted according to real household spending patterns from the Household Expenditure Survey, and it is the standard measure of consumer inflation in Singapore.
How much has the cost of living in Singapore risen over the past ten years? It depends heavily on the category. Between June 2016 and June 2026, SingStat's Consumer Price Index shows clothing down 0.4% and phone and internet down 5.5%, while recreation rose 19%, healthcare 24%, food 28% and transport 51%. There is no single figure that describes all of them.
Did wages in Singapore keep up with inflation? Broadly yes, on everyday costs. Real purchasing power compounded roughly 23% over the decade against daily expenses rising about 21%. Housing and COE rose around 50% each over the same period, which is where the gap opens.
Why does official inflation say housing rose only 11% when HDB prices rose far more? They measure different things. The housing component of CPI tracks the cost of living in a home you already occupy, including imputed rent, utilities and maintenance. The HDB Resale Price Index tracks what it costs to buy one. Both are accurate for what they measure.
Are HDB resale prices still rising in 2026? No. As of Q2 2026, the HDB Resale Price Index has been broadly flat for a year and has declined for three consecutive quarters.
What is doomspending? A term from a November 2023 Intuit Credit Karma survey describing spending driven by pessimism about the future rather than by wanting the purchase itself. The Straits Times covered the pattern in Singapore using Lendela's borrower data.
Are young Singaporeans impulsive with money? The research says no. IPS Working Paper No. 55 found that 88.8% of young Singaporeans spend within their income, while 80% simultaneously worry they spend too much and 60% would still spend on something that makes them happy. Those findings coexist rather than conflict.
Sources
SingStat, Consumer Price Index, June 2016 to June 2026
HDB Resale Price Index, Q2 2026
LTA COE bidding results via data.gov.sg
MOM, Labour Force in Singapore Advance Release 2025
Institute of Policy Studies, Working Paper No. 55, "Not Quite Impulsive Spenders", 2024 (fieldwork 2022)
Intuit Credit Karma, November 2023
The Straits Times, coverage of doomspending in Singapore
Mani, Mullainathan, Shafir and Zhao, "Poverty Impedes Cognitive Function", Science, 2013
Figures verified as at September 2026. Official statistics are revised periodically, so check the source for the latest data before relying on any single figure.
The Lendela Team
Lendela is a loan-matching platform that partners with 70+ MAS-licensed lenders. We aim to deliver a transparent, safe, and personalised loan-matching experience, empowering borrowers with confidence to choose what truly fits. Since launching in 2018, we’ve helped hundreds of thousands of Singaporeans make smarter, more informed financial decisions through clarity and control.